
▶ Update — May 6, 2026
Through ~130 PA, Kurtz has climbed to .244/.412/.412 and a 130 wRC+. The core thesis held: the exit velocity was real, the results came, and the slump resolved into above-average production. His walk rate jumped to 22 percent while his K% actually fell to 33 percent. But the recovery didn't happen the way I predicted. The Shadow contact rate isn't the story. His opposite-field power vanished entirely — zero oppo homers — and fastballs flipped from a strength to a severe weakness. The decisional problem I identified may have been real, but it manifested as a directional issue, not a zone-edge timing issue.
Click for full analysis ›
Ben Clemens at FanGraphs published "Nick Kurtz's Strange Encore" on May 6, and his data gives us enough to grade what I got right, what I got wrong, and what I missed entirely.
What the Original Analysis Got Right
The big call was correct. This was never a sophomore collapse, and the exit velocity wasn't lying. Kurtz's 130 wRC+ through a month-plus of what Clemens still calls a slump is exactly what I predicted when I wrote that his xwOBA would carry him even if the timing didn't fully resolve. The projection systems had him at 132 wRC+ for the full year. He's basically there already while still struggling.
The walk rate prediction was right too. I flagged that his selectivity was improving — that the passivity in the zone was a feature dressed up as a bug. His BB% has now jumped to 22.2 percent, which is elite. He strung together a 20-game walk streak. Pitchers are terrified of him even when he's not squaring them up.
The comp framework held. I said exit velocity direction was the differentiator between recoveries and collapses, and that Kurtz's +4.3 mph EV gain put him in a different category than Gorman or Greene. That's still true. His average and 90th-percentile exit velocities are both top-five in baseball. The contact quality hasn't degraded. The collapses in this comp set all featured EV declines. Kurtz's hasn't declined.
What I Got Wrong
The mechanism. I said this was a decisional problem — that his fast-swing rate cratered, that he was committing too late on Shadow pitches, and that the fix was recalibrating when to pull the trigger on edge pitches. I identified the key metric to watch as Shadow contact rate (61.2 percent, needed to reach 68–70 percent by June).
Clemens' data tells a different story, or at least a more specific one. The problem isn't edge-of-zone timing in general. It's opposite-field launch angle. In 2025, Kurtz's average launch angle on opposite-field fly balls was 34 degrees — basically the ideal home run angle for a guy who hits the ball 100+ mph. In 2026, that number is 41 degrees. He's getting under the ball when he goes the other way. At 100–105 mph exit velocity, that seven-degree difference drops his home run probability from 48 percent to 15 percent on those batted balls.
I should have looked harder at the spray chart data in April. His opposite-field power was his defining superpower in 2025 — a .750 wOBA going the other way, best in baseball by more than 100 points — and its total disappearance in 2026 is the specific mechanism behind the ISO crash. I was focused on the zone map when I should have been focused on the field map.
What Changed Since April 10
The fastball story flipped completely. When I wrote the original piece, Kurtz's pitch value against four-seamers was still positive (+1.14 per 100). I specifically called out sinkers, cutters, and curveballs as the problem pitches and noted that fastballs "remain positive." That's no longer true. Clemens reports he's slugging .618 against four-seamers (down from .776 in 2025) and .304 against sinkers (down from .623). His fastball run value dropped from third in baseball to 75th. What was the one pitch type still working for him in early April is now the primary source of his struggles.
The strikeout rate came down, though. From 40 percent at 50 PA to 32.7 percent at ~130 PA. That's still higher than his 2025 mark of 30.9 percent, but not the alarming spike I was reacting to. The combination of more walks and fewer strikeouts explains how his wRC+ climbed from 96.5 to 130 without the power returning.
What I Missed Entirely
The directional redistribution of his contact. Clemens shows that Kurtz is tattooing the ball up the middle — 97+ mph average exit velocity to center field — but that the deep part of the park is holding those balls in. Meanwhile, the opposite-field power that made him special has completely evaporated. This explains a phenomenon I couldn't fully account for in April: why his xwOBA stayed above average while his results tanked. Balls hit to center field systematically outperform their xwOBA less than balls hit to the corners. He was redirecting his best contact to the part of the field where results run below expected values.
I also missed the James Wood comp that Clemens surfaces. Wood hit .750 wOBA going the other way in 2025 (second in baseball behind Kurtz) and shared the same age, handedness, and K%/BB% profile. If I'd dug into the opposite-field data in April, Wood would have been a better active comp than any of the ones I used in the original piece.
The Revised Number to Watch
I'm replacing Shadow contact rate as the key metric. The number to watch now is his opposite-field launch angle on fly balls. If it drops from 41 degrees back toward 34–36, the home runs will come in bunches because the exit velocity is already there. That's a timing adjustment, not a mechanical rebuild — which is actually consistent with my original argument, just pointed at a different symptom.
Clemens' conclusion matches mine from April, stated more plainly: if Kurtz is hitting like this while failing at his single greatest skill, imagine what happens when it clicks back. The 97 mph exit velocity is still real. The 22 percent walk rate is new and maybe better than the power. And 130 wRC+ as a floor during a slump is not a problem. It's a promise.
▶ TLDR
Nick Kurtz's 2026 looks ugly on the surface: no home runs, a .220 average, and a 40 percent strikeout rate through 50 plate appearances. But the underlying data runs in the opposite direction. His exit velocity jumped 4.3 mph from his rookie season, his hard-hit rate climbed from 51 to 57 percent, and his xwOBA is still well above league average, meaning the contact he's making is legitimately dangerous. The problem is decisional, not mechanical: bat tracking shows his fast-swing rate cratered 10 points, meaning he's swinging too tentatively on edge pitches while letting too many hittable pitches go by called. The open question is whether he can recalibrate his timing on sinkers, cutters, and curveballs before those pitch values harden, and whether his pre-existing weakness against left-handed pitching is actually worse than last year's overall numbers let on.
Key number to watch: Shadow contact rate — 61.2% now, needs to reach 68-70% by June.
If you're new to baseball: When a hitter waits too long to commit to a swing, the bat can't get through the zone in time, and pitches that move late, breaking down or cutting sideways, are already past the sweet spot before the swing arrives. Think of it like trying to catch a ball someone threw off-line: you can still reach it, but you can't catch it cleanly. That's what's happening to Kurtz right now on edge pitches, and the strikeouts and soft contact are the result.
If you manage a fantasy team: Hold him, and consider buying if his price has dropped in your league. His barrel rate is close to his elite 2025 level, his walk rate is up to 18 percent, and all four projection systems still have him around 34 home runs and a 132 wRC+ for the year. The home runs haven't shown up yet because of bad luck on batted balls, not bad contact. The timeline for results is May through June.
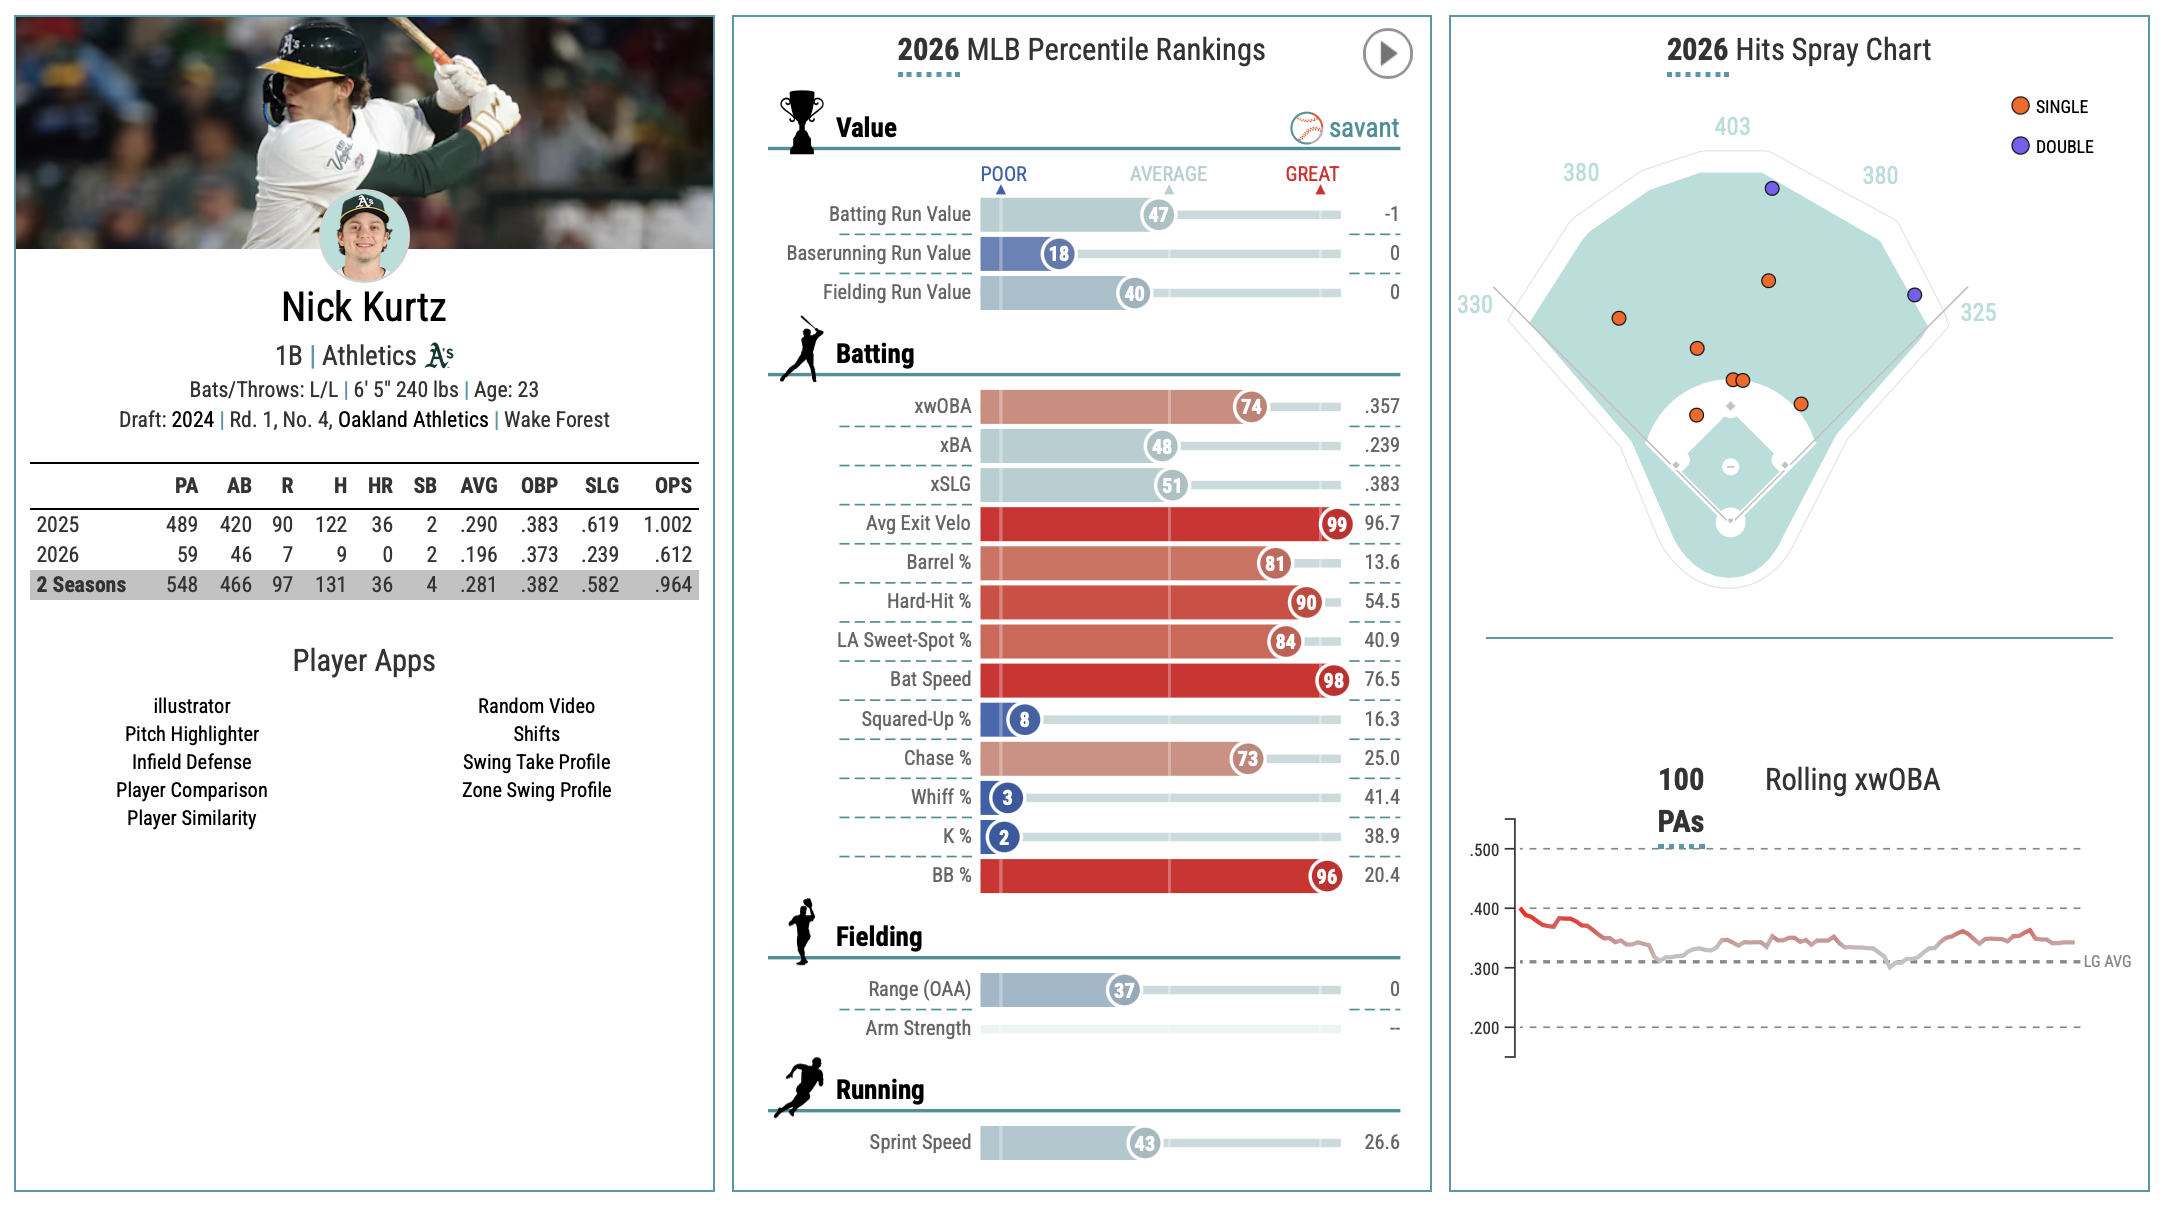
Nick Kurtz looked like Oakland's franchise cornerstone after his rookie season. He hit .290 with 36 home runs and a 170 wRC+ as a 22-year-old in 2025, the kind of debut that earns a $130 million extension offer.
Through 50 plate appearances in 2026, the box score tells a different story: a .220 batting average, zero home runs, and a 40 percent strikeout rate. It looks like a sophomore collapse.
It isn't. His exit velocity jumped 4.3 mph, his hard-hit rate climbed from 51 to 57 percent, and his xwOBA is still well above league average. He's hitting the ball harder than he did during his best season. The results just haven't caught up.
I dug into his pitch-type data, his zone profile, his bat tracking numbers, his platoon splits, and the trajectories of every recent left-handed hitter who went through a similar sophomore strikeout spike. What I found is a story about a changed approach at the plate, a pre-existing platoon weakness that his 2025 overall line hid from view, and one number that separates the hitters who recover from the ones who don't.
To understand the 2026 version of Kurtz, you have to start with what made the 2025 version so good.
The 2025 Baseline
Last year Kurtz looked like the kind of hitter the Oakland Athletics hadn't had since the Moneyball era. He slashed .290/.383/.619 with 36 home runs in 117 games. His ISO, slugging minus batting average and the cleanest measure of extra-base power, was .329. His xwOBA of .372 confirmed the production wasn't a mirage.
The most unusual thing about his 2025 season wasn't the power. It was the coverage.
FanGraphs tracks pitch values by type, measuring how well a hitter performs against each pitch on a per-100 basis. Kurtz had a positive value against every single pitch type. Fastballs, sinkers, sliders, cutters, changeups, curveballs. All positive.
That's rare for any hitter, and it's especially rare for a 22-year-old who struck out 30.9 percent of the time. He overcame the strikeouts because when he made contact, the ball was destroyed.
That balance between contact rate and contact quality is what made the early 2026 numbers so jarring.
What the 2026 Box Score Says
Through 11 games, Kurtz's surface numbers are alarming. He's hitting .220 with a .268 slugging percentage. His OPS is .628. He has two doubles and zero home runs in 41 at-bats.
His ISO is .049, down from .329. His wRC+ is 96.5, roughly league average, which for a first baseman is not a viable offensive profile.
It looks like a collapse. But the underlying data tells a completely different story.
What Statcast Says
Here's where the story splits from the box score. His expected slugging is .395, about half again as high as his actual .268, because the batted balls he's producing should be going for extra bases at a much higher rate than they are.
He's hit three barrels in 21 batted ball events, a 14.3 percent rate that's close to his elite 18.3 percent from 2025. Those three barrels produced zero home runs. In a full season, that doesn't happen.
His xwOBA is .356. League average is around .310. Even with the 40 percent strikeout rate, his underlying offensive value is above average.
That's partly because his walk rate has jumped from 12.9 percent to 18 percent, which is elite. He's not chasing. His chase rate is around 26 percent, roughly where it was in 2025. His discipline is intact or better.
So: harder contact, better plate discipline, worse results. Something specific is happening between the ears and the bat.
Nick Kurtz — 2025 vs. 2026
| Metric | 2025 | 2026 | Direction |
|---|---|---|---|
| AVG | .290 | .220 | ▼ |
| HR | 36 | 0 | ▼ |
| K% | 30.9% | 40.0% | ▼ |
| Exit Velocity | 92.7 mph | 97.0 mph | ▲ +4.3 |
| Hard-Hit% | 50.9% | 57.1% | ▲ +6.2 |
| BB% | 12.9% | 18.0% | ▲ +5.1 |
| xwOBA | .372 | .356 | ≈ |
| Barrel% | 18.3% | 14.3% | ≈ |
| SwStr% | 14.2% | 14.7% | ≈ |
2025: 489 PA, 273 batted ball events. 2026: 50 PA, 21 batted ball events. Green rows highlight metrics that improved. Source: FanGraphs.
What's Actually Happening at the Plate
The easy explanation for a 40 percent strikeout rate is "he can't catch up to pitches in the zone." The data says that's not it.
His swinging strike rate, the percentage of total pitches he swings at and misses, is 14.7 percent. In 2025 it was 14.2 percent. That's essentially unchanged. He's not whiffing more than last year.
What he's doing is taking more. His swing rate on pitches in the zone dropped nearly six points from 2025, meaning he's letting more hittable pitches go by. Some of those takes become walks (the BB% jumped). Some become called third strikes (the K% jumped).
His in-zone contact rate, by Statcast classification, actually improved from 76.6 percent to 82.3 percent.
He's striking out more while making better contact in the zone. That's a paradox worth unpacking.
FanGraphs divides the strike zone into four regions: the Heart (center of the plate), the Shadow (the two inches on either edge), the Chase (just outside), and the Waste (way outside). Here's where Kurtz's trouble lives:
His Heart contact rate is 81.8 percent. Fine.
His Shadow contact rate is 61.2 percent. Not fine.
Pitchers are throwing 40 percent of their pitches to the Shadow, and he's making contact on barely six out of ten of them. He's also swinging more at Shadow pitches than he did in 2025 (54 percent vs. 47 percent) while making less contact there.
He's caught in a bad middle ground: too passive on pitches over the middle of the plate, too aggressive on pitches near the edges.
The three pitch types he's struggling with tell the rest of the story. In 2025, his pitch value against sinkers was +2.50 runs per 100 pitches. In 2026, it's -6.15. Against cutters: +1.62 to -5.57. Against curveballs: +1.63 to -5.17.
In plain terms: sinkers, cutters, and curveballs, pitches he used to punish, are now beating him badly.
Those three pitches are the ones that move down or laterally across the Shadow zone, and they've flipped from strengths to severe weaknesses. Fastballs and sliders, which arrive on straighter planes with less late movement, remain positive.
I should be transparent here: these pitch-value numbers are based on roughly 15 to 40 pitches per type. The sample is small enough that any single pitch-type value could move substantially in either direction. They're hypotheses, not verdicts.
But the pattern they describe, where the vulnerable pitches are exactly the ones that punish a hitter who waits too long to commit, is consistent enough to take seriously.
Kurtz's Pitch Values — 2025 vs. 2026 (runs per 100 pitches)
| Pitch | 2025 | 2026 | Swing |
|---|---|---|---|
| 4-Seam FB | +3.07 | +1.14 | -1.93 |
| Slider | +2.23 | +1.64 | -0.59 |
| Sinker | +2.50 | -6.15 | -8.65 |
| Cutter | +1.62 | -5.57 | -7.19 |
| Curveball | +1.63 | -5.17 | -6.80 |
| Changeup | +1.32 | -1.60 | -2.92 |
Red rows: pitches that flipped from positive to severely negative. Positive values = runs above average for the hitter. 2026 values based on 15-40 pitches per type. Source: FanGraphs (Statcast classification).
What the Bat Tracking Data Shows
My initial hypothesis was a swing change. The +4.3 mph exit velocity gain between a player's age-22 and age-23 seasons isn't normal year-to-year fluctuation. If Kurtz had steepened his swing plane over the offseason to generate more lift, it would explain the EV jump, the pitch-type flips, and the contact-rate tradeoff.
The bat tracking data says otherwise.
His attack angle dropped from 14.3 degrees to 13.4. His bat tilt flattened from 39.1 to 37.4 degrees. His bat speed dipped slightly, from 77.2 mph to 76.4. A swing retool for more lift should produce a higher attack angle, not a lower one. The swing itself hasn't changed in the direction the hypothesis predicted.
What has changed is how he's using it.
His fast-swing rate, the percentage of swings at high speed, cratered from 72.6 percent to 62.3. That's a 10-point drop. He's making more slow, tentative swings, the kind a hitter produces when he's not fully committed to the pitch. His squared-up contact rate fell from 29 percent to 26. His blast contact rate fell from 22 percent to 17.
Meanwhile, his contact point has moved deeper in the box (22.8 inches vs. 23.4) and further from the plate (29.4 inches vs. 27.7). He's letting the ball travel longer before committing, and when he does commit decisively, the contact is harder than it's ever been. But when he doesn't commit, the swing is slow and the result is poor.
This isn't a mechanical change. It's a decisional one.
He's waiting longer, being more selective, and punishing the pitches he does jump on. The 97 mph exit velocity is real. It's coming from the subset of swings where he fully commits. The problem is everything else: the tentative swings on the Shadow, the called third strikes on pitches he watched go by, the sinkers and curveballs that have moved two inches further by the time he decides to swing.
The good news is that approach changes are more correctable than mechanical ones. A hitter can recalibrate his timing and decisiveness faster than he can rebuild a swing. The bad news is that 77 competitive swings is a small sample, and the bat tracking numbers could still shift as the season develops.
The Splits Problem
Here's where the Kurtz story gets more complicated. His 2025 season, the one everyone remembers as elite, already contained a severe weakness hiding inside the overall numbers.
Against right-handed pitching in 2025, Kurtz hit .336/.439/.714 with 27 home runs and a 1.153 OPS. Against left-handed pitching, he hit .197/.261/.423 with 9 home runs and a .684 OPS.
That's a 469-point OPS gap.
The .290 batting average and 36 home runs on the season were a weighted average of an MVP candidate against righties and a below-average hitter against lefties.
Kurtz's 2025 Platoon Split
| Split | PA | AVG | OBP | SLG | OPS | HR | K% | BB% |
|---|---|---|---|---|---|---|---|---|
| vs RHP | 336 | .336 | .439 | .714 | 1.153 | 27 | 28.9% | 15.2% |
| vs LHP | 153 | .197 | .261 | .423 | .684 | 9 | 35.3% | 7.8% |
469-point OPS gap. Source: MLB Stats API.
In 2026, both sides have deteriorated. His K% against RHP jumped from 28.9 percent to 35.3 percent, a 6.4-point spike. Against LHP, it jumped from 35.3 percent to 50 percent in 16 plate appearances.
The RHP spike is within the normal range for a sophomore adjustment (and consistent with the approach change the bat tracking data suggests). The LHP spike is alarming, though the sample is small enough that I wouldn't build a house on it.
What this means for the overall picture: the "decline" in 2026 isn't a single story. It's two.
Against right-handers, he's going through an adjustment that the exit velocity data suggests he'll come out the other side of. Against left-handers, he may have always been a limited hitter, and the 2026 struggles are amplifying something that was already there.
The Comps
Sophomore strikeout spikes happen to a lot of young left-handed power hitters. The question is which ones recover.
I looked at every LHH from 2022 to 2025 who had a strong first season followed by a year-two K% jump, and one metric separated the recoveries from the collapses.
It wasn't strikeout rate. It wasn't batting average. It was exit velocity direction.
Nolan Gorman's K% jumped from 31.9 percent to 37.6 percent from 2023 to 2024. His exit velocity dropped 2.5 mph. He never recovered, settling into an 87 to 88 wRC+ range.
Riley Greene's K% jumped 4 points from 2024 to 2025. His EV dipped 1.4 mph. He partially recovered but lost a tier of overall production.
Triston Casas's K% jumped 6.6 points. His EV dipped slightly. Injuries muddied the picture.
Every comp who had a sophomore K% spike also saw their EV decline or hold flat.
Sophomore K% Spikes — Exit Velocity Is the Differentiator
| Player | Yr 1 K% | Yr 2 K% | Yr 1 wRC+ | Yr 2 wRC+ | EV Change | Outcome |
|---|---|---|---|---|---|---|
| Gorman '23–24 | 31.9% | 37.6% | 118 | 87 | -2.5 mph | Never recovered |
| Greene '24–25 | 26.7% | 30.7% | 134 | 121 | -1.4 mph | Partial recovery |
| Casas '23–24 | 25.1% | 31.7% | 131 | 120 | -0.9 mph | Injuries |
| Wood '25–26 | 32.1% | 30.5% | 127 | 134 | -1.3 mph | K% dropped, wRC+ up |
| Kurtz '25–26 | 30.9% | 40.0% | 170 | 97 | +4.3 mph | TBD |
All players: LHH, age 22-25, K% 25%+ in year 1. Kurtz's 2026 wRC+ and K% are through 50 PA. EV change = average exit velocity year-over-year. Source: FanGraphs.
Kurtz's EV went up 4.3 mph. His hard-hit rate went up 6 points. He's the only hitter in this comp set whose batted-ball quality improved during the slump.
James Wood, the Washington outfielder who shares Kurtz's age, handedness, and K%/BB% profile, is the closest active comp. Wood maintained elite batted-ball metrics through his adjustment and has a .390 xwOBA through 59 plate appearances in early 2026.
The worst case is the Gorman path, where the K% keeps climbing and the underlying quality deteriorates. Kurtz's 2026 EV and hard-hit data argue against it, because the thing that broke in Gorman (the contact quality) is the thing that's improved in Kurtz.
What to Expect
The four major projection systems, ATC, Steamer, ZiPS, and OOPSY, have all incorporated the early 2026 data and still project Kurtz for a .256/.344/.510 line with 34 home runs and a 132 wRC+. The 489 plate appearances from 2025 carry about 90 percent of the inferential weight against 50 PA of new data.
These systems are doing exactly what they should: anchoring on the prior, updating incrementally, and not overreacting to April.
I think those projections are roughly right, with one caveat: the platoon split suggests his overall line will depend heavily on how managers deploy him against lefties. If he's a full-time player regardless of the opposing pitcher's arm, the LHP matchups will drag the composite numbers down. If he sits against tough lefties, the composite looks better.
The home runs are coming. Three barrels in 21 batted balls doesn't stay at zero home runs. The exit velocity and hard-hit rate say the power is real. The projection systems agree.
The number I'm watching is his Shadow contact rate. It's 61.2 percent right now, down from 64.9 in 2025. League average is in the low 70s.
If it climbs toward 68 or 70 percent by June, it means he's recalibrating his timing, learning to commit earlier on edge pitches while keeping the power gains. If it stays in the low 60s, the strikeout rate won't come down as far as the projections expect, and we're looking at a hitter who trades more power for less contact than last year's version.
Either way, the 97 mph exit velocity is real, and it doesn't lie. Fifty plate appearances of box score noise doesn't change what a man can do to a baseball.
Update added May 6, 2026. Original scouting report above is unedited.