
▶ Mid-Season Update
Five weeks later, most of what I was worried about in April unwound. Friedl's swing isn't broken. He's just not hitting. The bigger story now is that his eye at the plate has come apart, and that's not something I saw coming.
Click for full mid-season analysis ›
When I wrote the original piece in April, I closed it with five things to watch. I told myself I'd revisit them once the sample got bigger. Three of them have come back in his favor. One is still impossible to tell. One nobody has answered. And the new bad news isn't on the list at all.
The Stuff I Was Worried About Wasn't It
The April panic was about his swing. He was rolling over everything, hitting nothing in the air, and his bat path looked like it was getting longer week by week. I said at the time that if those numbers settled down once the sample grew, I'd have to walk it back. They did, and so I am. His ground balls are back where you'd expect them. His squared-up contact is actually a hair better than last year. His swing isn't getting longer anymore. The defense is fine. He looked like a guy whose mechanics were unraveling on a small sample, and once the sample got bigger, the unraveling stopped.
Two things I still can't say much about. He hasn't run enough for the basestealing data to mean anything. And the injury question, which I raised at the end of the original piece, hasn't gotten any clearer. Nobody has answered it because nobody has asked.
Where I Went Too Hard
The piece I wrote argued that all of these things — the longer swing, the soft contact, the ground balls — were one big problem moving in the same direction. They weren't. They moved separately, and they came back separately, which is what should happen when you stare at a few weeks of data and try to read a story into it. The hedges I put on the individual numbers were the right call. The bigger story I wove around them wasn't.
What I Didn't See Coming
His eye at the plate has fallen apart. He's chasing pitches he used to lay off, missing pitches he used to hit, walking less, and striking out a lot more. Last year his discipline at the plate was the best part of his game. This year it's the worst. I framed the early whiffs in April as a side effect of the swing change. With the swing back to normal and the whiffs still happening, that explanation doesn't hold.
I also underestimated how badly the platoon split would collapse. Last year he was good enough against righties and passable against lefties, which is the recipe for an everyday center fielder. Right now he isn't either. There's nobody on the schedule he's hitting, and Terry Francona is reading the lineup card accordingly.
What I Got Right
The argument under the article was that Friedl's contact quality has been quietly bad for years and that his speed and defense were the thing covering for it. That part held up. The cushion is gone. The numbers that used to flatter him aren't flattering him anymore, and the expected-stat models don't see a hidden good hitter underneath this. There's no rebound waiting in the wings.
The speed and defense piece is partial. Sprint speed held. He's been perfect on the bases. The defense is fine. The "game speed eroding" framing isn't really showing up in 2026, at least not yet. The bat is the thing that fell off a cliff. The legs and the glove are still where they were last year.
What I'm Watching Now
The chase rate. That's the one. The mechanics question fixed itself, the discipline question didn't. If he stops swinging at junk by the middle of June, his speed and defense can probably get him back to something useful, even if it's nothing pretty. If he doesn't, Dane Myers is going to start eating into his playing time and you'll know how the story ends. The projection systems still expect a near-average hitter the rest of the way, mostly because of last year. The bet now is whether anything in 2026 is enough to change their mind.
▶ TLDR
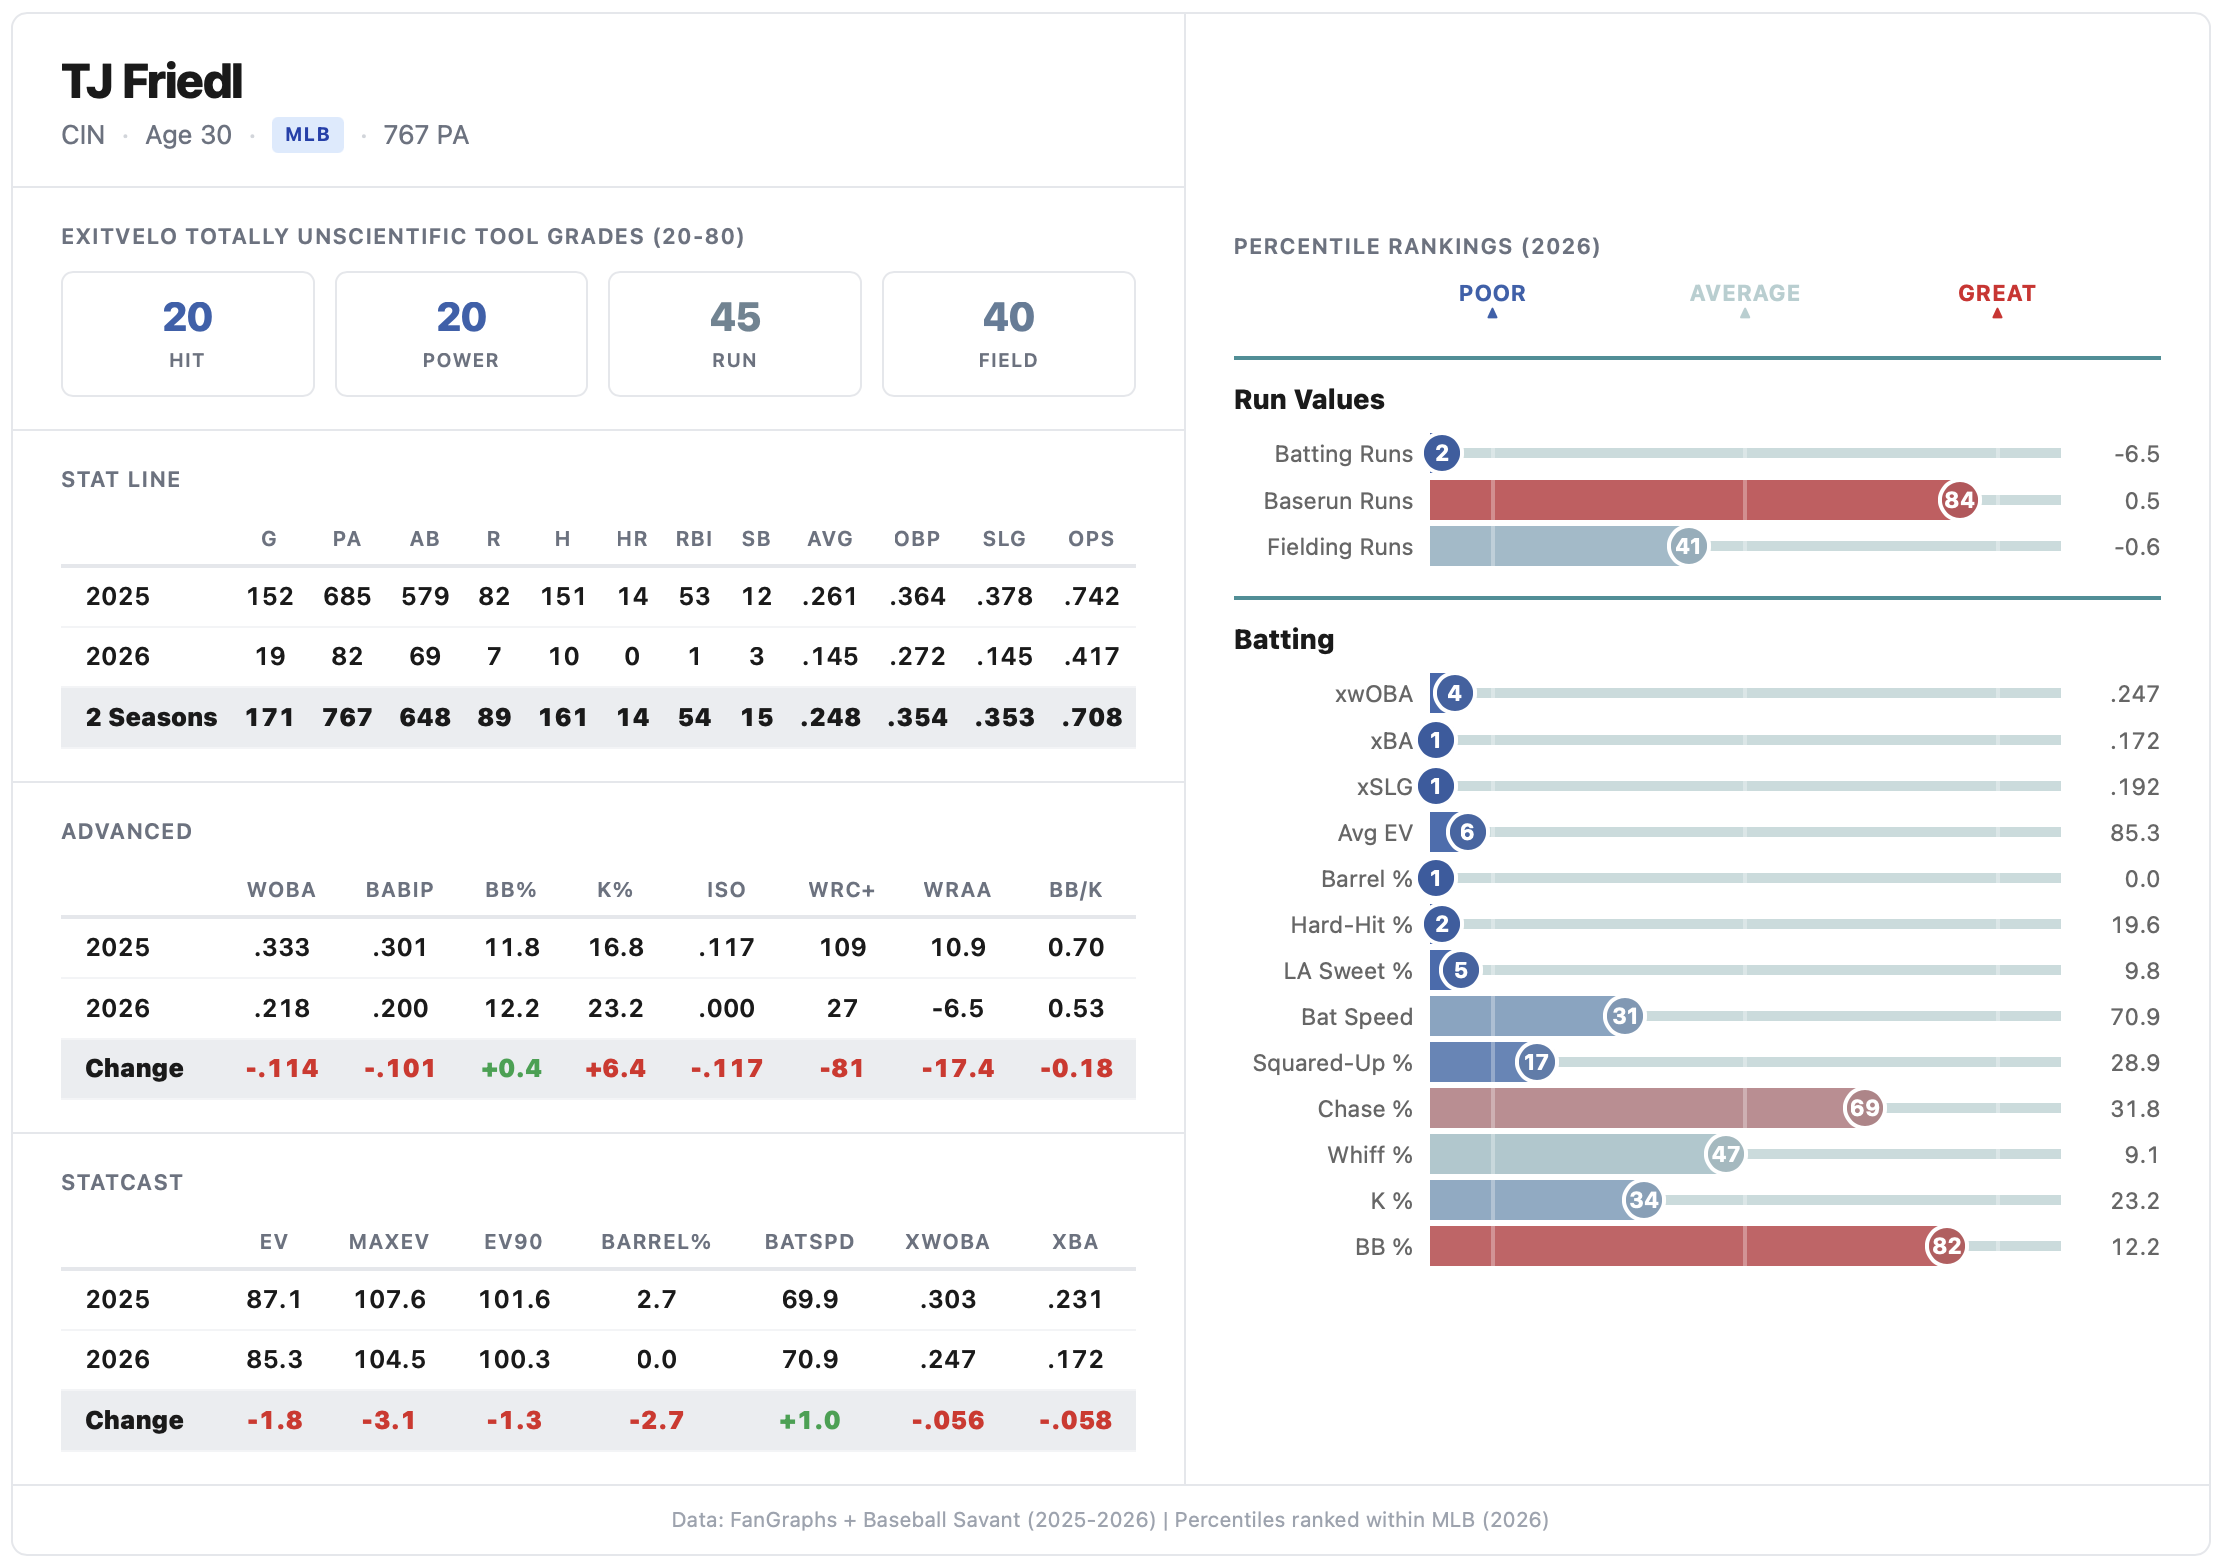
TJ Friedl's 2026 start (.153/.286/.153, zero extra-base hits in 70 plate appearances) looks like an April disaster, but the underlying pattern has been building for four seasons. His isolated power has declined every full year since 2022 (.196 to .189 to .155 to .117 to .000), his ground ball rate has climbed steadily, and his FanGraphs Speed score has dropped from 7.24 to 4.42. The disconnect is that his bat speed is the highest it's been since tracking began in 2023 and his walk rate is at a career best, but he's lost the ability to square the ball up. He looks like a player trying to manufacture power his bat can no longer produce cleanly, and the speed and defense that used to fill the gap are eroding as he approaches 31.
If you're new to baseball: Friedl is a small, fast center fielder whose offense depended on beating out ground balls, stealing bases, and bunting for hits. Think of it like a car that runs on a turbocharger instead of a big engine. When the turbo starts losing boost, the car still cruises fine on flat ground. It's on the hills, under load, where the pressure loss shows up first. Friedl's top-end sprint speed has held. His game speed, the burst off the line, the explosive secondary lead, the first step on a ball in the gap, has been the hill he can't climb anymore.
If you manage a fantasy team: He's a drop in all but the deepest leagues. Projection systems still see an 86–96 wRC+ hitter on the strength of his 2025 full season, but neither system accounts for the swing mechanics change. Sunk costs are irrelevant. If you're in a 15-team league with an active wire, there's almost certainly a better use of that roster spot. The one exception: if he's your primary source of steals in a shallow league and the wire is genuinely barren, hold and watch his squared-up contact rate. If it's still below 28% by late May, even that argument collapses.
So far in 2026, TJ Friedl's bat speed is 70.8 mph, the highest it's been since Statcast began tracking swings in 2023. His walk rate is 14.3%, a career best by a wide margin. Unfortunately, he also has zero extra-base hits in 70 plate appearances.
The numbers point in opposite directions: a hitter seeing the ball better than ever, swinging the bat faster than ever, but producing the worst offensive output of his career. Through 15 games, he's slashing .153/.286/.153 with a 35 wRC+. His isolated power is .000. That's not a typo.
So what's happening with TJ Friedl?
Fifteen games is too few to call anything a collapse. But his ground ball trend isn't new, his power erosion isn't new, and neither is his game speed decline. This is just the first season where the Friedl's speed couldn't cover for the weakening contact anymore.
The hard truth of the matter is that TJ's hit tool alone has never been good enough to carry him offensively. Not in his best season in 2023, and not now. But what made him productive were the skills around the bat: the speed that turned routine grounders into infield hits, the baserunning that stretched singles, the defense that kept him in the lineup on days the bat couldn't justify it. Those were the skills that Reds fans fell in love with.
His legs filled the gap between what his underlying metrics said his contact deserved and what he actually produced. Unfortunately, it looks like those legs are slowing down, and the gap they filled is closing.
What Speed Built
Friedl at his peak was a legitimately excellent player, and the numbers that follow will feel harsh if you don't remember the context.
In 2023, he was excellent. He hit .279/.352/.467 with 18 home runs and 27 stolen bases in 138 games, good for 4.14 WAR, and he played elite center field defense. He was 27 years old, and he looked like a core piece of a competitive Reds roster. That production was real. It wasn't a mirage, and I'm not going to pretend it was.
But even in 2023, his Statcast contact quality told a different story. His xwOBA was .290, ranking in the 17th percentile. His exit velocity was 86.7 mph. His barrel rate was 3.2%, his hard-hit rate was 27.6%. Every measure of how hard and how well he struck the baseball graded out in the bottom 10% to 15% of the league. His bat produced contact that, in Statcast's expected-value framework, deserved roughly an 85-to-90 wRC+ season. And yet he still posted a 117 wRC+ that season.
What filled the difference between his expected stats and his actual stats was his incredible speed. Seventeen bunt hits, 7 infield hits, 27 stolen bases, 8 triples. He reached base on balls that other hitters couldn't leg out, stretched singles into doubles, turned doubles into triples. His .308 BABIP was inflated by his speed, because he could beat out throws after making soft contact.
These are legitimate skills. I want to be clear about that, because the story I'm about to tell could be mistaken for "he was always worse than he looked," and that's not quite right. Speed, bunts, and defense are real production. The problem is that those skills don't age well, and the decline, while gradual, has been visible in the underlying data for four years.
Friedl's Decline by the Numbers: 2022 to 2026
Isolated Power (ISO)
Barrel Rate
Stolen Bases
Triples
FanGraphs Speed Score
Sprint Speed (ft/s)
2022 was a 72-game sample. Dashed lines and hollow dots indicate 2026 in-season data (15 games). Speed Score not available for 2022 or 2026. Sprint speed in blue. Source: FanGraphs (2022–2025), Baseball Savant (2026).
Every line is trending in the same direction—down. His isolated power has declined every full season since his 2022 debut: .196 to .189 to .155 to .117 to .000. His barrel rate followed the same path. These are not noisy fluctuations across a cold month. They span 1,886 career plate appearances.
The stolen bases tell the most interesting version of this story. His raw totals fell from 27 in 2023 to 12 across a full 152-game season in 2025, but here's the part I didn't expect to find: his stolen base attempt rate in 2026 is actually higher than 2025. He's attempting more steals, not fewer. His three steals in 15 games pace to roughly 32 over a full season, which would be a career high.
But the quality of his running is declining even as the intent stays the same. He's not hesitating. He's just slower where it counts: the burst, not the top speed.
Friedl's Running Metrics: 2022 to 2026
| Metric | 2022 | 2023 | 2024 | 2025 | 2026 |
|---|---|---|---|---|---|
| Sprint Speed (ft/s) | 28.1 | 28.3 | 26.5 | 26.7 | 26.6 |
| HP-to-1B (sec) | 4.27 | 4.27 | 4.44 | 4.42 | 4.48 |
| 90-ft Sprint (sec) | 3.86 | 3.86 | 4.04 | 4.01 | 4.06 |
| Speed Score | 7.19 | 7.24 | 4.99 | 4.42 | — |
| Secondary Lead, SB att. (ft) | — | — | 24.56 | 23.51 | 20.09 |
2026 based on 20 competitive runs and 2 tracked steal attempts. Secondary lead tracking began in 2024. Speed Score not yet available for 2026. Source: Baseball Savant, FanGraphs.
The sprint speed chart shows exactly when the drop happened. Friedl lost nearly two feet per second after his 2024 injuries and never got it back. But sprint speed at least stabilized at the lower level. His game speed, the acceleration, the first-step quickness, the explosiveness on a secondary lead, kept declining.
You lose triples not because you forgot how to run, but because the burst that turns a long double into a triple isn't there the way it used to be.
What It Means for the Reds
The news cycle has already started asking the questions that the data has been answering for two years. Yahoo Sports floated a trade scenario on April 16. Red Reporter asked whether Friedl should keep the leadoff spot on April 7. RotoWire reported the Reds sitting him against left-handed pitching on April 4. A defensive miscue made the Cincinnati Enquirer the same week. The conversation is shifting from "when does he heat up?" to "is this who he is now?"
The projection systems still see a useful player. ATC projects a 95.9 wRC+ for the rest of the season, below average but not replacement level. ZiPS is more pessimistic at 86.4. On the WAR side, ATC sees 1.7 and ZiPS 0.9, both buoyed by defensive value and playing time rather than offensive production.
Friedl's not going to get a lot of help from his home park, either. Great American Ball Park carries a 119 HR factor over the past three seasons, making it a top-10 home run environment, and Friedl posted an overall .117 ISO in 2025 while playing 81 games there. But no park can save a hitter who doesn't elevate the ball.
Friedl still walks at an above-average rate, he can still run a little, and he plays excellent center field defense. Those are real skills. But the leadoff production and extra-base power we saw in previous year? Those are probably gone. The version of Friedl we saw last season was already a lesser player than the one Cincinnati fell in love. The 2026 version is testing how much further that baseline can fall.
If you're a Reds fan, the honest framing is this: the player you watched in 2023 was a legitimate above-average regular, and the skills that made him that player are entering a natural decline phase as he approaches 31. That's not a failure; that's a common career arc. The question for Cincinnati is whether they build around what he still does well or whether they give Dane Myers more playing time.
The Ground Ball Problem
If the speed story explains why Friedl's production outpaced his contact quality for four years, the batted ball data helps explains why it stopped. As I said earlier, the downtrend didn't start in this season.
Friedl's ground ball rate has trended upward across his career, and the 2024 dip during his injury-shortened season didn't change the overall direction across 1,886 career plate appearances. That's not noise.
Friedl's Batted Ball Distribution: 2022 to 2026
2022 was a 72-game sample. 2026 based on 41 batted ball events (dashed lines, hollow dots). Source: FanGraphs (2022–2025), Baseball Savant (2026).
His 2026 rate of 60.5% on 41 batted ball events will almost certainly regress. The question is where it settles. Even 45% would be a career worst, and the trajectory suggests the true rate is somewhere north of the 40.4% he posted across a full 2025 season.
What makes the 2026 numbers alarming isn't his ground ball rate alone. It's what happened to the rest of the distribution. His line drive rate collapsed from 22.0% in 2025 to 7.9%. His fly ball rate dropped from 37.6% to 31.6%. His infield fly ball rate barely moved: 16.5% to 16.7%. The missing line drives and fly balls almost entirely became ground balls.
The distribution tells the real story: the line drives that used to live in the 10-to-25-degree band have migrated downward into the ground ball range, while the high-angle balls (popups) stayed roughly constant. The average didn't change because the extremes held. The middle collapsed.
His sweet spot rate dropped from 32.8% in 2025 to 9.8% through 41 events. Even the balls he does elevate are carrying less: his exit velocity on fly balls and line drives fell from 91.0 mph to 82.1 mph, his maximum batted ball distance shrank from 415 feet to 325 feet, and even his average distance dropped from 154 to 99 feet. In other words, he's hitting easy ground balls softer and more frequently than ever.
The Swing Length Problem
Here's an interesting fact: TJ Friedl's bat speed is faster than ever. So why is he hitting the ball with less power and elevation?
I expected a steeper attack angle or a launch angle change to explain the ground ball spike. The bat tracking data points somewhere else.
Friedl's bat speed is at its highest mark since tracking began: 68.6 mph (2023) → 70.5 (2024) → 69.9 (2025) → 70.8 (2026). His fast-swing rate, the percentage of swings at high effort, jumped from 5.9% to 9.8%. So he's swinging harder more often than he used to, which in isolation sounds like a good thing.
It isn't. For one, his bat speed still sits well below the league average of 72.0 mph, and his fast-swing rate of 9.8% is less than half the league average of 26.1%. These aren't disqualifying, but it ain't great either.
Friedl's game never required league-average bat speed. It required precision, an ability to get the barrel on the ball consistently with a compact, controlled swing. His squared-up contact rate of 36.9% in 2025 ranked above the 80th percentile. He didn't need to hit it hard. He just needed to hit it clean. And he was great at that.
So far in 2026, that precision has collapsed. His squared-up contact rate through 92 competitive swings is 25.7%, down from 36.9%. His blast rate fell from 11.9% to 4.3%. His whiff rate jumped from 16.9% to 23.9%. He's swinging harder, longer, and missing more.
When it comes to hitting the ball, TJ's swing length is the thread that ties it together. The ground ball rate, the diminished power, and the increased swing and miss. All pf this is because his swing had been getting longer and longer the beginning of the 2025 season.
Friedl's Half-Season Bat Tracking: 2024 to 2026
| Period | Bat Spd | Swg Lng | Atk Ang | EV | LA | Swings |
|---|---|---|---|---|---|---|
| 2024 1H | 70.4 | 6.96 | 9.3° | 83.6 | 18.8° | 141 |
| 2024 2H | 70.5 | 6.75 | 8.9° | 83.1 | 18.1° | 336 |
| 2025 1H | 69.4 | 6.67 | 9.4° | 82.9 | 15.3° | 518 |
| 2025 2H | 70.5 | 6.79 | 9.3° | 83.7 | 19.0° | 375 |
| 2026 | 70.8 | 6.88 | — | 84.1 | 15.1° | 92 |
Bat speed in mph, swing length in feet. 2026 attack angle not yet available from Savant. Source: Baseball Savant pitch-level downloads (half-season) and bat tracking leaderboard (season-level).
His swing length is the one metric with a consistent directional change across every measured season half. It's still well below the league average of 7.32, so we're not talking about a wild, looping swing (which is common among power hitters with elite bat speed). But for a player whose entire offensive identity depended on a short, controlled path to the ball, a two-inch lengthening over three measured periods is significant. He's reaching, extending, trying to generate something the compact swing wasn't producing anymore.
My working hypothesis is that Friedl is lengthening his swing to manufacture the power his bat speed alone can't produce, and the longer path is costing him the barrel precision that made his contact-first approach work. He's swinging harder and longer, but making worse contact. It looks like a player who watched his ISO fall from .196 to .117 over four seasons and decided, consciously or not, to swing his way out of it.
I should acknowledge a counterpoint. His second-half 2025 bat tracking looked genuinely better than the first half. If you squint at that, the deterioration looks more sudden than the multi-year trends imply. Maybe the 92-swing sample in 2026 is a mechanical hiccup, not a structural shift. That's possible. But his swing length continued to increase from 6.79 to 6.88 while the other key metrics we discussed have worsened. His second-half recovery didn't change his overall power trend, and I tend to trust a trend until it's proven guilty.
What Would Change My Mind
-
If his ground ball rate settles back to 42% by 200 plate appearances, the batted ball panic so far this season it noise overlaid on a mild trend. The four-year directional change in his ground ball rate is real, but his 2026 acceleration to 60.5% is almost certainly overstated by the 41-event sample. A settled rate of 42% to 44% would still be a career worst, but it would be a manageable one.
-
If his squared-up contact rate recovers above 33% by mid-season, matching his career baseline, the swing mechanics change may be temporary. A lengthening swing can be shortened back. But the question is whether the lengthening is a conscious adjustment that the coaching staff can reverse, or an involuntary timing shift that reflects something deeper. I don't have video analysis to distinguish between those two possibilities, and no one on the Reds' coaching staff has commented publicly on his swing path.
-
If his secondary lead on steal attempts recovers from 20.09 feet toward 23 feet or above, with 10 or more attempts to stabilize the sample, the game speed erosion thesis weakens. Right now his secondary lead number is based on only two steal attempts with available tracking data in 2026, which is nothing as a sample.
-
There's also the injury question that no one has answered. Friedl has a history of hamstring issues. His home-plate-to-first-base time has slowed from 4.42 to 4.48 seconds, his running splits show him falling behind past 40 feet, and his FanGraphs Speed score is declining while his top-end sprint speed holds. A chronic soft-tissue issue could explain all of this without showing up on an IL stint. We don't know, and I don't want to speculate beyond what the data supports. But someone should ask.
-
The defensive metrics are the other unknown. His 2025 Outs Above Average ranked in the 72nd percentile. If that appears to be holding up in a month or so, his floor is a defensive asset with a bad bat. If it's declining alongside his game speed, the floor drops further than the projections expect. He also has to contend with the fact that Dane Myers is an excellent defensive CF. If Myers's bat heats up, Friedl's going to face some stiff competition.
If I were to watch one number for the next month, that would be his squared-up contact rate. At 36.9% in 2025, his bat-to-ball precision compensated for below-average bat speed and kept his contact-first approach viable. At 25.7% through 92 swings, it doesn't. If that number is above 33% by the end of May, he'll probably be hitting in the top half of the order. If it's below 28%, he's not. You can track it yourself on Baseball Savant's Bat Tracking leaderboard, which is sortable by player and includes squared-up per swing and squared-up per contact.
The Comps
Friedl's trajectory has historical company. Jacoby Ellsbury followed a similar arc in his early 30s: a speed-first center fielder whose game speed eroded before his sprint speed did, whose ISO declined across consecutive seasons, and whose bat stopped compensating once the legs couldn't cover for the contact quality.
Reds fans are very familiar with Billy Hamilton's career, which is the most extreme version of this story: a player whose generational raw speed kept him in lineups long after his bat stopped deserving the at-bats, until the speed itself declined and there was nothing left.
In both cases, the decline was structural. Neither player found a second gear once game speed started falling. The pattern isn't guaranteed for Friedl, but for this player archetype, recovery is the exception, not the rule.
Mid-season update added May 22, 2026. The original April 19 scouting report above is unedited.