
▶ Roster Update
Hinds went 4-for-33 with 18 strikeouts across 36 plate appearances after the call-up. The Reds optioned him on May 3, designated him for assignment on May 17, and traded him to the Miami Marlins on May 21 for right-handed pitcher Zach McCambley. The diagnosis in this article held, the forecast did not. Pitchers attacked Zone 14 on 30 percent of pitches, the same share they used in 2024 and 2025, and Hinds whiffed on 84 percent of his swings there.
Click for full update with charts ›
I pulled all 148 pitches Hinds saw across his 36 plate appearances with the Reds, and the pattern was the same playbook the original article documented from 2024 and 2025. Pitchers threw 30.4 percent of their pitches into Zone 14, down and outside the strike zone. The prior MLB sample was 30.5 percent. They didn't bother adjusting because they didn't have to.
Where the 2026 version got worse is what filled in for the breaking ball. Sweepers were 17.6 percent of his diet, second only to sinkers, and he whiffed on 78.6 percent of his swings against them. Sliders went for 60 percent. Changeups, 54 percent. The pitch types shifted, but the down-and-away corridor stayed the same. Most of his strikeouts ended on a pitch in Zone 14, and three of those came on sweepers alone.
The Watch List Held; the Forecast Didn't
The watch box at the bottom of the original article called the thresholds correctly. Strikeout rate above 40 percent meant 2025 again. He posted 50 percent. Chase rate below 38 percent meant the approach held. He chased 42.4 percent, right back into the 42–45 percent band his prior MLB stints lived in. The Zone 14 whiff problem, listed as the gating skill, ran at 84 percent on swings. The framework worked. The thing it was watching just kept happening.
The walk rate is the harshest read. I hedged that the 19.7 percent AAA mark would settle at 12 percent, maybe drift back toward 8. It came in at 2.8 percent across 36 PA, below the floor I set. The strikeout rate was the only one I called real without qualification. Chase rate I framed as a test, walk rate I hedged toward 8 percent. The strikeout rate didn't hold, which means by my own framing the others were never going to.
About That Bat Speed and Max EV
I cited 75-plus mph bat speed and a 115 mph max exit velocity as part of the elite-tools case. Neither held in the MLB sample. His bat speed in 2026 with the Reds was 73.1 mph, still above league average but not the elite tier I framed it as. His max exit velocity was 109.5 mph. His 2024 MLB max was 112.7. The 115 number lives somewhere in batting practice or AAA, not in the games that decided his roster spot.
His launch angle in 2026 was 26.1 degrees, well past the optimal window and into popup territory. The article tracked his AAA launch angle climbing from 12.3 to 16.8 degrees and called that progress. It overshot. Combined with the exit velocity drop, his 2026 barrel rate was zero. Not low. Zero.
What I Got Right and What I Missed
The mechanism was right. The trap-door description, the breaking-ball-down sequencing, the diagnosis that Hinds's MLB problem was a chase problem and not a contact-quality problem, the thresholds in the watch list, the speculative-add-only fantasy verdict. All of it survived contact with the data.
What I missed was how unlikely it was that any of the AAA improvement would translate. Strikeout rate is the stickiest offensive metric in baseball, and his had genuinely improved across three minor league seasons. I treated that as evidence the underlying skill had changed. The MLB sample says it changed against 89 mph breaking balls and didn't change against 86–95 mph ones with sharper shape and smarter sequencing. The version of "down and away" that Triple-A pitchers throw is, again, not the version major league pitchers throw, and I should've leaned harder on that caveat instead of letting the optimism carry the close.
What Comes Next
The Marlins sent him to Triple-A Jacksonville the day they acquired him. Zach McCambley, the pitcher the Reds got back, is a 26-year-old AAA reliever; that's the market's read on Hinds's residual value. He's still 25, he can still hit a baseball 109 mph when he connects, and someone in Miami's player development group will get a turn at the same problem the Reds couldn't solve. The next time we see him, it won't be in red. The third stint was the last one.
▶ TLDR
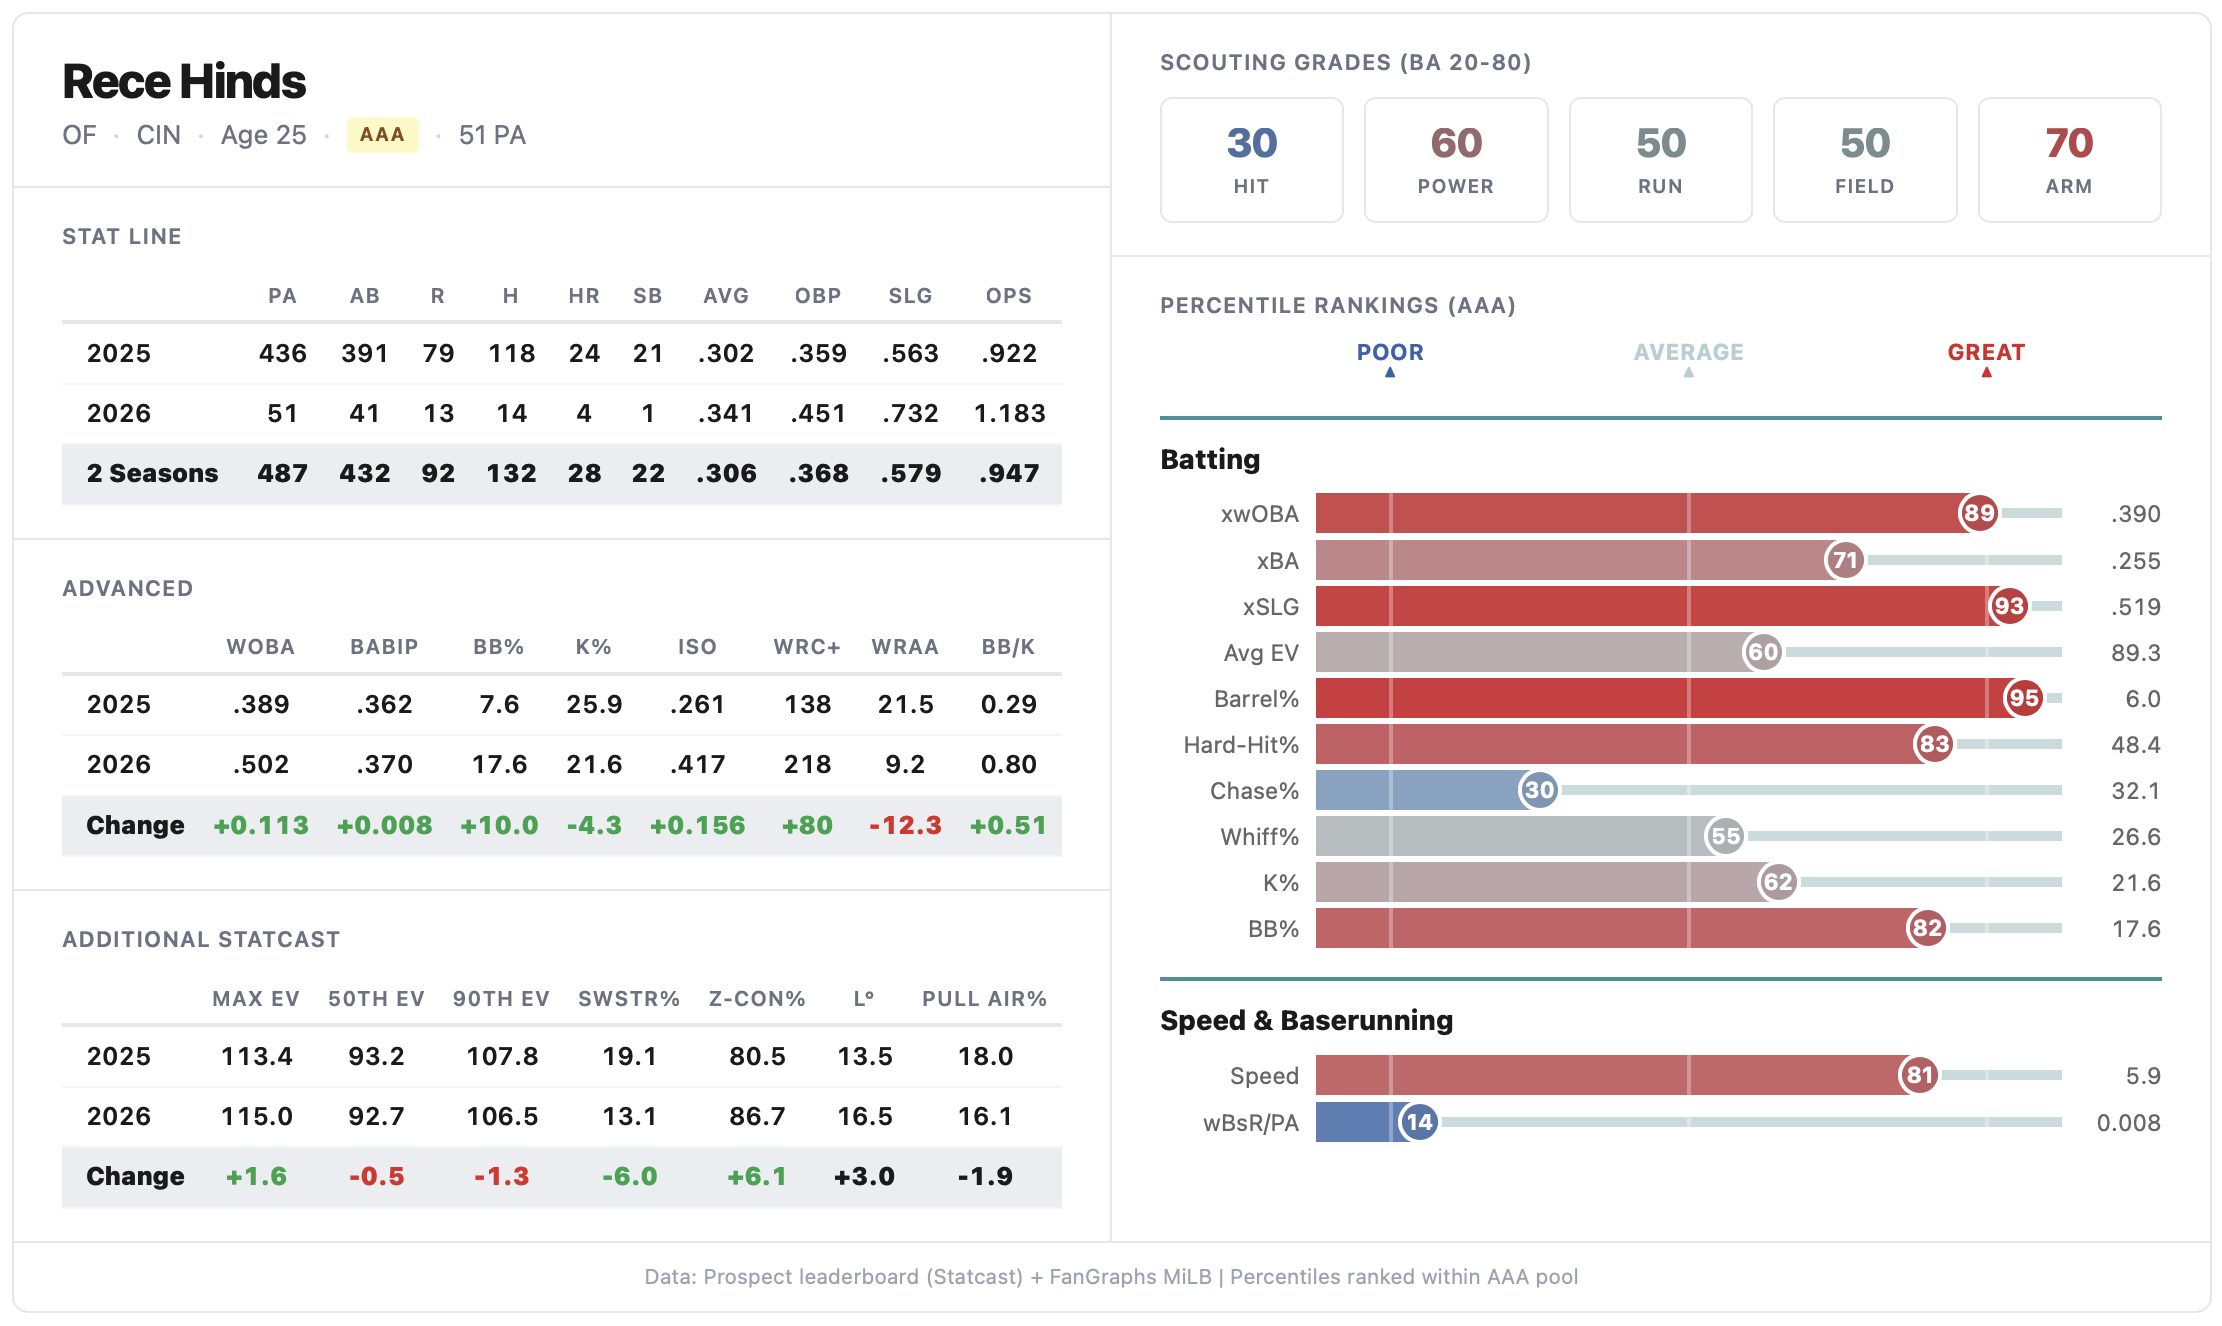
Hinds' .354 Triple-A average is a mirage, running .108 ahead of his expected batting average on a .414 BABIP. The real story is underneath: his strikeout rate has dropped from 37.9 to 24.6 percent across three AAA seasons, his whiff rate fell from 40 to 27 percent, and his chase rate is down. Those are the exact skills that collapsed in his prior MLB stints, where he posted a 47.7 percent strikeout rate and a 1.9 wRC+. Whether they survive major league pitching is the open question.
If you're new to baseball: Pitchers kept throwing sliders and curveballs low and outside the strike zone, pitches that look hittable out of the hand but drop below the bat by the time they arrive. Hinds kept swinging at them. He's spent three years in the minors learning to lay off those pitches.
If you manage a fantasy team: Speculative add, but don't drop anyone you'd regret. Watch his strikeout rate through 60 plate appearances: below 33 percent means the improvements are translating, above 40 percent means it's 2025 again. His bat speed (75+ mph) and max exit velocity (115 mph) are elite.
The Reds optioned Noelvi Marte to Triple-A Louisville on Sunday, and C. Trent Rosecrans of The Athletic is reporting that Rece Hinds will be the corresponding call-up. Hinds has been hitting .354 with a 219 wRC+ in Louisville and was recently named International League Player of the Week. He's 25, he has elite power tools, and the Reds clearly (and desperately) want to see if that power can be sustained in the big leagues.
I want to see it too. But I've also watched this movie before, and the last time it ended with a 47.7 percent strikeout rate.
Hinds' .354 average is running .108 points ahead of his expected batting average, which measures how well his batted balls should be falling for hits based on how well he his the ball. His BABIP is sitting at .414, well above what any hitter can sustain. Strip the luck away and his real production looks more like .254/.391/.543 (still excellent for Triple-A). But the his average, xBA, and BABIP aren't the numbers I'll be watching when arrives in Cincy.
I dug into every pitch Hinds saw across both of his prior MLB stints, all 354 of them, and matched that against three years of Statcast data from Triple-A. What I found is a hitter who has made genuine, measurable improvements to the specific skills that previously failed him in the majors, and one number that could tell us whether they'll stick this time.
Inside Every Rece There Exists Two Hinds
Hinds' major league career consists of 95 plate appearances split across two stints that look like they belong to different players.
But we should probably start with what he is: a 6-foot-4, 215-pound slugger, built like a guy who could play tight end if baseball hadn't worked out. At the plate, his swing is violent and direct. Louisville fans have watched him launch batting practice home runs into places where normal hitters hit pop flies. And the world saw it briefly in 2024 when he hit five home runs immediately after getting promoted to the majors. The tools have never been subtle.
Let's linger in the warmth of that moment a little longer. In July and August of 2024, he hit .261/.333/.717 with five home runs in 51 plate appearances. That was good for a 176 wRC+. His exit velocity averaged 91.6 mph with a max of 112.7, and he was hitting the ball hard enough to generate a .395 xwOBA, which is well above average. We hadn't seen a debut like this in Cincinnati since, well, Aristides Aquino. That should've been a sign, because Hinds began to struggle with a high strikeout rate soon thereafter.
In May and June of 2025, he came back up again. This time, the results were disastrous. During his second stint in the main roster he hit .116/.136/.279. That's a 1.9 wRC+. Not 101, not 91. 1.9. He struck out in nearly half his plate appearances (47.7 percent). His walk rate collapsed to 2.3 percent. It was one of the worst 44-PA stretches in recent memory.
Here's another fact about his 2024 and 2025 time in the show interesting: his exit velocity was essentially the same. He averaged 91.6 mph in 2024 and 92.5 in 2025. His hard-hit rate was 40 percent in 2024 and 50 percent in 2025. When he connected, the ball was hit hard in both stints.
Again, the dude never had a problem with his swing. The problem was in his approach.
Hinds' Two MLB Stints
| Metric | 2024 (51 PA) | 2025 (44 PA) |
|---|---|---|
| AVG / OBP / SLG | .261 / .333 / .717 | .116 / .136 / .279 |
| K% | 31.4% | 47.7% |
| BB% | 7.8% | 2.3% |
| xwOBA | .395 | .250 |
| Exit Velocity | 91.6 mph | 92.5 mph |
| Hard-Hit% | 40.0% | 50.0% |
| Contact% | 64.7% | 48.4% |
Green rows highlight metrics that stayed stable or improved. Both stints are small samples (51 and 44 PA). Source: FanGraphs, Baseball Savant.
How MLB Pitchers Beat Him
When I pulled every Hinds's pitch-by-pitch data turn his time in MLB, the pattern was so clean it almost looked scripted. It was clear pitchers had his number.
MLB pitchers threw 30.5 percent of their pitches to one location: down and outside the strike zone. That's the area below the bottom of the zone and toward the outer edge of the plate, what Baseball Savant calls Zone 14. Think of it as a trap door. A slider or curveball starts its flight looking like it might clip the bottom of the strike zone, and the hitter's brain says that's hittable. But by the time the bat arrives, the pitch has dropped below the zone. The hitter's hands can't adjust fast enough, and he either whiffs or puts it weakly into the ground.
Sometimes a young sluggers can overcome this with high bat speed, but they can't do it consistently. At a certain point you end up swing and missing more often than not, and that's exactly what happened to Hinds in 2024 and 2025. A lot of us can remember exactly what it looked like when he swung out of his shoes and missed a breaking ball badly low and away in the zone.
Hinds chased nearly 40 percent of pitches in that location. When he swung, he missed 79.1 percent of the time. Fourteen of his 37 career strikeouts ended on pitches in that one spot. He got exactly one hit there.
Once pitchers had him worried about the breaking ball down, they flipped to elevated four-seam fastballs. Twelve of his 37 strikeouts came on fastballs, mostly above the zone. His whiff rate on four-seamers jumped from 25.9 percent in 2024 to 62.5 percent in 2025 (though that second number is built on only 16 swings). In his first stint, he could handle the heater. But in his second, he couldn't.
The one-two punch worked like a boxing combination. The breaking ball low is the jab that gets you reaching. The fastball high is the cross that catches you leaning. One sets up the other because your eyes can't calibrate for two speeds and two trajectories at the same time.
Where was Hinds actually dangerous? Pitches at belt height or above, middle to inside. His whiff rate on pitches up in the zone was only 24.1 percent, and he produced eight hits from that location. Mid-inside, he didn't miss a single swing. His career home runs came off pitches in that area, hit at 110 to 113 mph. His power is there, but pitchers stopped throwing to that location after about a week.
There was a book on Hinds, and they'd all read it.
Where Pitchers Attacked Hinds (354 MLB Pitches)
| Location | Pitches | Swing% | Whiff% | K | Hits |
|---|---|---|---|---|---|
| Down-Outside (ball) | 108 | 39.8% | 79.1% | 14 | 1 |
| Down-Inside (ball) | 50 | 54.0% | 48.1% | 4 | 0 |
| Up-Outside (ball) | 31 | 32.3% | 60.0% | 4 | 0 |
| Mid-Middle (zone) | 25 | 88.0% | 13.6% | 2 | 7 |
| Mid-Inside (zone) | 14 | 64.3% | 0.0% | 0 | 2 |
Whiff% = percentage of swings that missed. "Ball" locations are outside the strike zone. Source: MLB Stats API pitch-by-pitch data, 354 pitches across 96 PA (2024–2025).
The breaking-ball-down, fastball-up sequence is not unique to Hinds. It's the default playbook against every power hitter with chase rate problems. What made it so effective against him is that he swung at 47 percent of breaking pitches outside the zone and whiffed on 72.6 percent of those swings, producing zero hits and seventeen strikeouts. He could hit breaking balls in the zone just fine, with a 36.5 percent whiff rate and seven hits. The issue was swinging at the ones he had no chance of reaching.
What's Changed
Hinds has spent parts of three seasons at Triple-A Louisville, and the progression tells a more interesting story than the .354 average.
His strikeout rate has dropped each year: 37.9 percent in 2024, 25.9 percent in 2025, 24.6 percent in 2026. That's a 13-point improvement over 919 combined plate appearances. The strikeout rate is the stickiest offensive metric in baseball, meaning it stabilizes faster and fluctuates less than almost any other number. When it moves this consistently in one direction over three years, it's not noise.
His whiff rate, the percentage of swings that miss the ball entirely, dropped from 40.1 percent to 34.2 percent to 27.1 percent. And his walk rate jumped from 7.6 percent in 2025 to 19.7 percent in 2026 (though that number is built on only 61 plate appearances and will almost certainly come down).
The most interesting number isn't any single metric. It's the ratio of pitches he took versus pitches he swung at. In 2024, Hinds swung at more pitches than he let go: 855 swings, 813 takes. In 2025, he was even more aggressive: 934 swings, 739 takes. In 2026, the ratio flipped. He's taken 118 pitches and swung at 107. For the first time in his career, he's taking more pitches than he's swinging at.
That doesn't mean he's being passive. His swing rate on pitches in the zone only dropped from 77.8 to 70.6 percent, meaning he's still aggressive when pitches are over the plate. The selectivity gain is coming from laying off the ones outside the zone, which is exactly the skill that collapsed in his MLB stints.
Hinds' Triple-A Improvement (Three-Year AAA)
| Metric | 2024 | 2025 | 2026 | |
|---|---|---|---|---|
| K% | 37.9% | 25.9% | 24.6% | ▼ |
| BB% | 8.8% | 7.6% | 19.7% | ▲ |
| Whiff% | 40.1% | 34.2% | 27.1% | ▼ |
| xwOBA | .290 | .357 | .402 | ▲ |
| Barrel% | 13.6% | 13.0% | 20.6% | ▲ |
| Launch Angle | 12.3° | 13.5° | 16.8° | ▲ |
| Ground Ball% | 44.3% | 37.7% | 33.3% | ▼ |
| Takes : Swings | 0.95 | 0.79 | 1.10 | ▲ |
2024: 422 PA. 2025: 436 PA. 2026: 61 PA (small sample, directional only). xwOBA and Barrel% from Baseball Savant MiLB data. Source: FanGraphs MiLB, Baseball Savant prospect leaderboard.
The xwOBA line is what I keep coming back to. His has risen from .290 to .357 to .402 across three AAA seasons. I believe genuine and sustainable improvement, and it holds up even after you remove the .414 BABIP and the flashy counting stats.
His batted ball profile shifted in the right direction, too. The table tells the story, but the short version is that he's getting the ball in the air more consistently, and for a hitter with his exit velocity, that's the difference between groundouts and extra-base hits. His barrel rate jumped from 13 percent to 20.6 percent, meaning a larger share of his batted balls are hitting the sweet spot where exit velocity and launch angle combine for maximum damage.
Against Quality Pitching
My assumption going into the pitcher quality data was that Hinds's improvements would fade against better arms, that he'd look fine against the back-end starters and AAAA hurlers, but fall apart against anyone with a real MLB future. That's not what the numbers showed.
During 137 plate appearances facing pitchers with meaningful MLB experience or top-prospect status, his strikeout rate only rose about three points compared to the overall AAA number. His ISO was actually higher against quality arms (.328) than against other AAA pitching (.251).
Against pitchers throwing 93 mph or harder, he posted a 19.2 percent strikeout rate across 52 plate appearances, a sample too small to be conclusive but large enough to notice. His bat speed click in at 75-plus mph, which is elite at all levels. This tells me that Hinds swings harder against velocity rather than being overwhelmed by it.
I want to be careful with this finding. Fifty-two plate appearances against hard throwers is not a large sample, and the pitchers he faced at 93-plus in Triple-A are not the same as the guys who'll come after him in the majors. Plus, he struggled with getting set up by breaking balls the last time he was called up. But the pattern is the opposite of what I expected, and it's consistent with a hitter whose bat speed gives him a physical advantage against velocity that slower-handed hitters don't have. Combine that with signs of an improved plate approach and you've got legit reasons to be hopeful in 2026.
The Honest Complications
AA improvement does not automatically become MLB improvement, and the history of power-over-contact hitters who dominated Triple-A but couldn't adjust to major league pitching is long and full of names nobody remembers. Apologies, Christian Encarnacion-Strand.
Louisville is a hundred miles from Cincinnati. Close enough that the organization can shuttle guys back and forth like commuters, and far enough that each trip down carries weight. Hinds has made this drive twice now and come back both times. The Reds sending Marte down to make room for him suggests they think (hope?) the third version is different from the first two. Organizations don't always get that right, but they have video and coaching context that the data can't provide.
The walk rate is the other red flag I can't ignore. Jumping from 7.6 percent to 19.7 percent in 61 plate appearances is dramatic, but walk rate needs about 120 PA to stabilize as a reliable indicator of true skill. It could settle at 12 percent, which would still be an improvement. It could also drift back toward eight.
The velocity gap matters, too. The average pitch speed he faced in AAA was 89.1 mph. MLB average fastball velocity is about 95 mph, higher among starters. That's not a trivial difference. Five extra miles per hour means roughly 25 fewer milliseconds to decide whether to swing, and that fraction of time is exactly where his 2025 MLB problems lived. The sweepers are sharper, the changeups have more drop, and the sequencing is smarter. The version of "down and away" that Triple-A pitchers throw is not the version major league pitchers throw.
What to Watch
The Hinds Watch List
Track these three numbers through his first 60 PA (~2.5 weeks of everyday play).
Strikeout Rate
AAA 2026
24.6%
Chase Rate
AAA 2026
32.1%
Zone 14 Test
Breaking balls down-outside
79.1%
The number I'm watching is his strikeout rate in his first 60 MLB plate appearances. That's roughly two and a half weeks of everyday play, and it's where the strikeout rate starts to stabilize as a meaningful indicator rather than random noise.
If it stays below 33 percent, the improvements are translating. His MiLB chase rate dropped from 38.4 to 32.1 percent, and his MLB chase rates in 2024 and 2025 were in the 42 to 45 percent range. If the chase rate this time settles below 38 percent, the approach change survived the jump. And if he's laying off pitches in that trap-door zone, down and outside, where pitchers threw 30 percent of everything they had against him, the rest of the improvements follow from there.
If the strikeout rate spikes above 40 percent, it means the velocity gap won, or the sequencing was too much, or the approach change that worked against 89-mph breaking balls didn't hold against 94-mph ones. That's a real possibility. The projection systems have him pegged as a roughly league-average hitter with minimal playing time, and they may be right.
His bat speed is 75-plus mph. His max exit velocity is 115 mph. His barrel rate has climbed every year. He's tooled up in the power department. But can his pitch recognition catch up to his swing. Three years of Triple-A data, 919 plate appearances of steady improvement, say it's catching up. The next 60 plate appearances tell us whether it caught up enough.
Data: FanGraphs exports, Baseball Savant MiLB prospect leaderboards, MLB Stats API pitch-by-pitch data.
Roster update added May 22, 2026. The pre-call-up scouting report above is unedited.